A household energy system is a large purchase made on trust. Rooftop solar, a hybrid inverter, a battery and now residential hydrogen storage are sold with annual figures: so many kilowatt-hours a year, so much self-sufficiency, payback in so many years. The buyer cannot check those numbers, and the seller often cannot show how they arise.
For the businesses selling these systems — installers, home builders, energy retailers and equipment makers — that is a commercial problem. Long sales cycles, sceptical customers, and after-sales complaints when the battery is empty on a winter evening the brochure never mentioned. The question every household really asks is simple: on my roof, with my usage, what will this system do, and when?
What a digital twin means for a house
A home energy digital twin models the specific house — its roof, its arrays, its equipment, its load — and runs a full year hour by hour on real weather for its location. Every hour the twin decides where the energy comes from and where it goes, the same way the system's controller would, and keeps an exact balance.
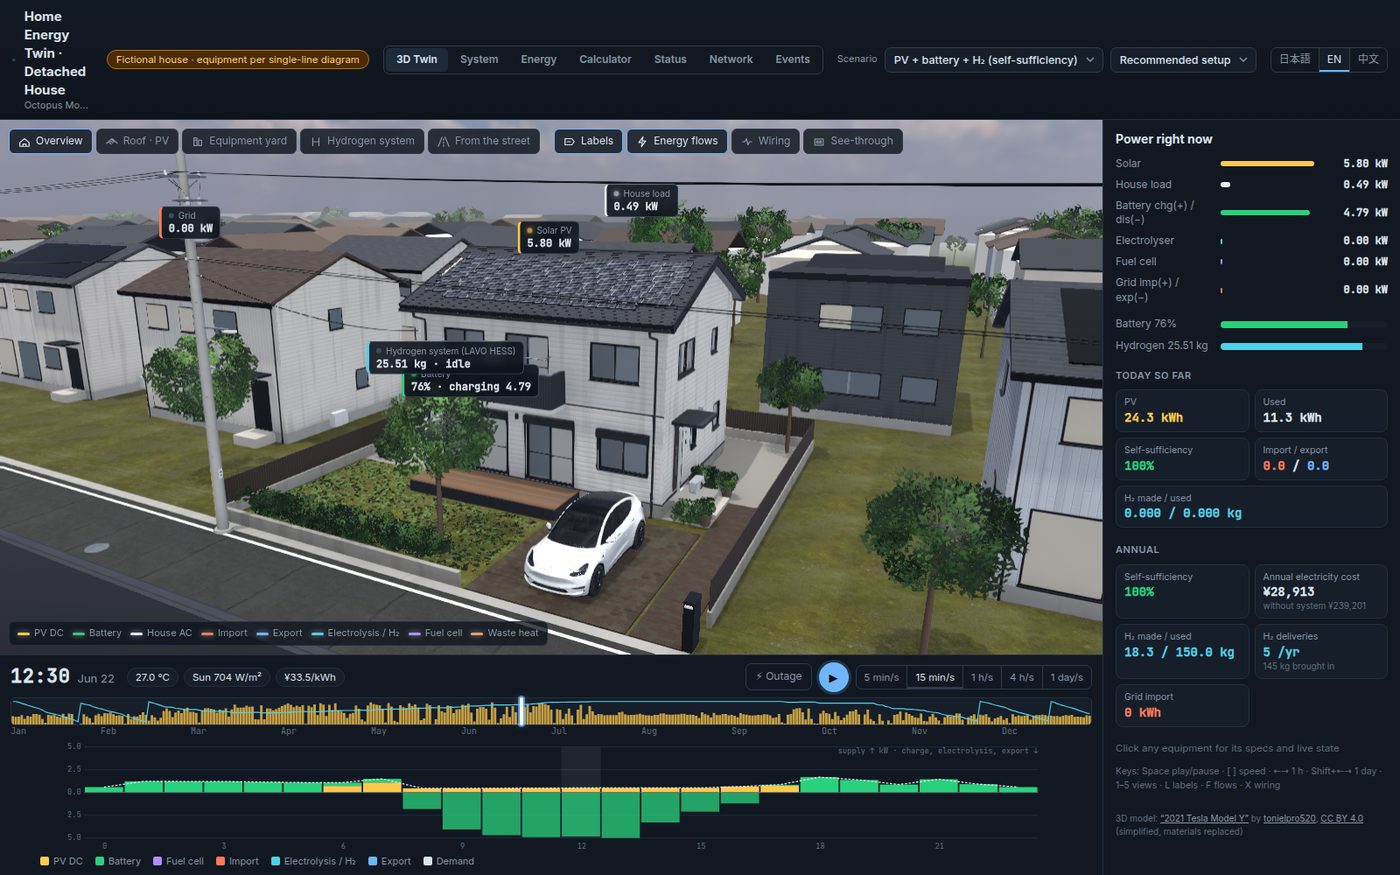
That turns an annual promise into 8,760 visible hours. A buyer can scrub to a December evening and see whether the battery, the hydrogen store or the grid is carrying the house.
What we built
Our Home Energy Twin is a fictional detached model house in Japan with rooftop PV, a hybrid power-conditioning system, an LFP battery and a residential hydrogen system: electrolyser, metal-hydride store and fuel cell.
- Real solar data, cross-checked. Hourly typical-year irradiance comes from PVGIS, with PVGIS PVcalc and NASA POWER used as cross-checks. Sun position, plane-of-array irradiance, cell temperature and inverter curve are modelled; the annual PV yield is tested to stay within 8 % of the PVGIS reference.
- Hydrogen from published specifications. The hydrogen system is modelled on a published residential hydrogen storage product's specifications; values the maker does not publish are listed as assumptions, and the cabinet stops outside its rated temperature range.
- Four operating strategies on the same year. PV only, PV with battery, self-sufficiency and economic, compared on the same weather and load.
- A single-line diagram drawn 1:1 from the engineering drawing, animated by the simulation, next to the 3D house with live energy flows and an annual analysis dashboard.
- One file for installation parameters, with a list of what to collect on site, so a real house can be entered without touching code.
Questions it helps answer
- For this roof and this household, how much of the year does solar plus battery cover — and which weeks does it not?
- Does adding hydrogen storage change winter self-sufficiency, or only summer surplus?
- Which strategy should the system run: maximise self-use, or minimise cost under the tariff?
- How big a battery is enough before extra capacity stops paying for itself?
- What will the customer see on the coldest, darkest week of the year?
What changes
Before: proposals are a PDF with annual totals. Customers compare quotes on price per kilowatt. Engineering and sales describe the system differently. After installation, the first surprise becomes a complaint.
After: the proposal is a link to the customer's own house, with the year visible hour by hour and the assumptions listed. Options (bigger battery, add hydrogen, change strategy) are compared side by side on the same weather. Sales and engineering use the same model and the same single-line diagram. Expectations are set before the contract, not after the first winter.
Getting there in your business
- Discovery. Your product range and specifications, typical roof and array configurations, the tariffs your customers are on, and how you size systems today.
- Prototype on your data. We enter one or two real installations — parameters from the site, solar data fetched for their coordinates — and check the twin against their metered production and consumption.
- Connected twin. For deployed systems, inverter and meter data can feed the twin so customers and your service team see actual against expected.
Questions worth asking any vendor:
- Is the solar input fetched for the exact location, from which dataset, and cross-checked against what?
- Which equipment values are published specifications and which are assumptions — and are the assumptions listed?
- Does the model conserve energy every hour of the year?
- Can the customer see the bad weeks, not just the annual total?
Honest limits
The house is a fictional model house and several parameters are typical values rather than measured ones. The household load is synthetic until meter data is available. Fuel-cell power and efficiency are assumptions because they are not published. The twin is not a substitute for an electrical design or a site survey. It is a private demo; an access code is available on request.
See it
- Private demo: home.octopustwin.com — ask us for an access code
- Case study: Home Energy Twin
- Selling or designing home energy systems? Talk to us.