
4D Midstream Digital Twin
A fictional 255 km products pipeline with tank farm, pump stations, block valves, metering, a branch and a delivery terminal. Pressure, flow, temperature and inventory evolve through space and time; 47 synthetic sensors observe the line, the twin produces expectations, and residuals feed evidence-based anomaly analysis.
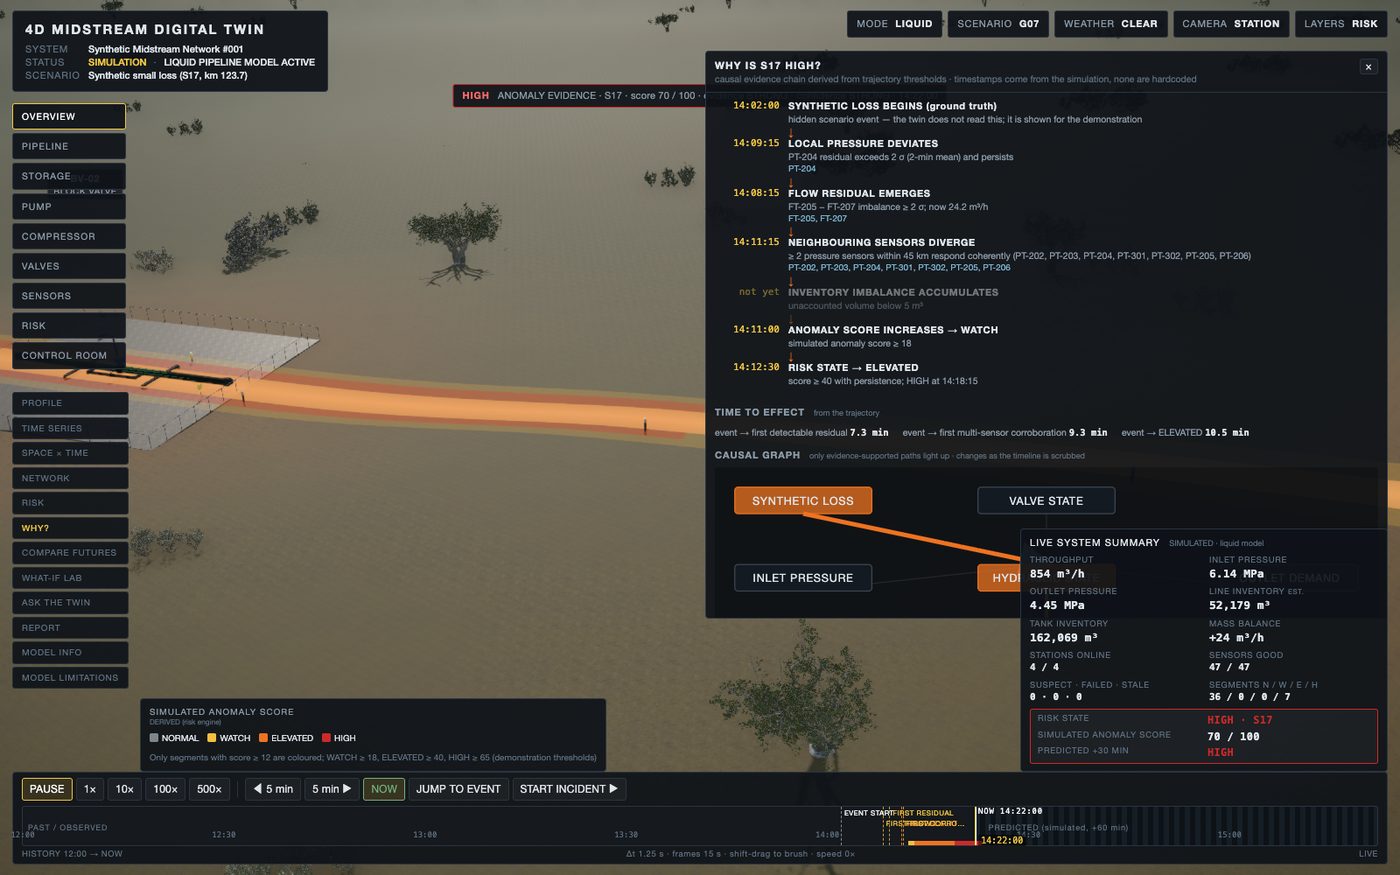
- main line + branch + lateral
- 255 km
- sensors with quality flags
- 47
- counterfactual futures from any moment
- 4
- unit tests + browser acceptance checks
- 43 + 42
The challenge
A pressure drop on a long line can be a leak, a drifting transmitter or an operating change. Alarms fire on thresholds; operators need to know which hypothesis the evidence supports, where, and what happens next.
What we built
- 1-D transient hydraulic model sampled at 134 points along the network
- Every sensor record carries observed, expected, residual, normal scale and quality
- Seven evidence channels build an anomaly score; competing hypotheses list supporting and contradicting facts
- Space × time heatmap, pipeline profile and derived causal chain
- Continue, reduce throughput, isolate or change pump — simulated from the identical estimated state
Outcome in the twin
A synthetic loss is distinguished from pressure-sensor drift by evidence rather than thresholds, the anomaly region is localised along the line, and four futures can be compared before any action is taken.
Path to production
Replace synthetic sensors with SCADA / historian feeds, calibrate the hydraulic model per segment, and run the evidence engine in shadow mode beside the existing leak-detection system.
Technology
About this build
Fictional network; simplified 1-D model; the anomaly score is not a probability. Engineering report →
Resort Twin · HVAC
Warehouse Twin
Have a system you want to see, question or rehearse?
Tell us about the site, the process and the decision. We will come back with what a twin could answer, which data it needs, and how fast a prototype can be in front of your team.