Restaurants run on thin margins and many small decisions. A supplier raises the price of one ingredient. A cook portions a little generously. A promotion moves volume to a lower-margin dish. A store over-orders and throws stock away. Each is minor; together they decide whether a store makes money.
The owner usually finds out from the monthly P&L. By then the cause is weeks old, spread across thousands of transactions, and the report says what happened to food cost, not why. With five stores, each with its own habits, the question "which store, which dish, which ingredient, which supplier?" can take an accountant days.
What a digital twin means in a restaurant group
For a restaurant group, a digital twin is not a 3D kitchen. It is a working model of the business: every sale linked to the recipe that was plated, every recipe linked to ingredients, every ingredient linked to purchases, suppliers and stock on hand. Because the links are explicit, the model can trace a number back to its causes and run forward to test a change — a new supplier, a price rise, a menu change — before you commit.
What we built
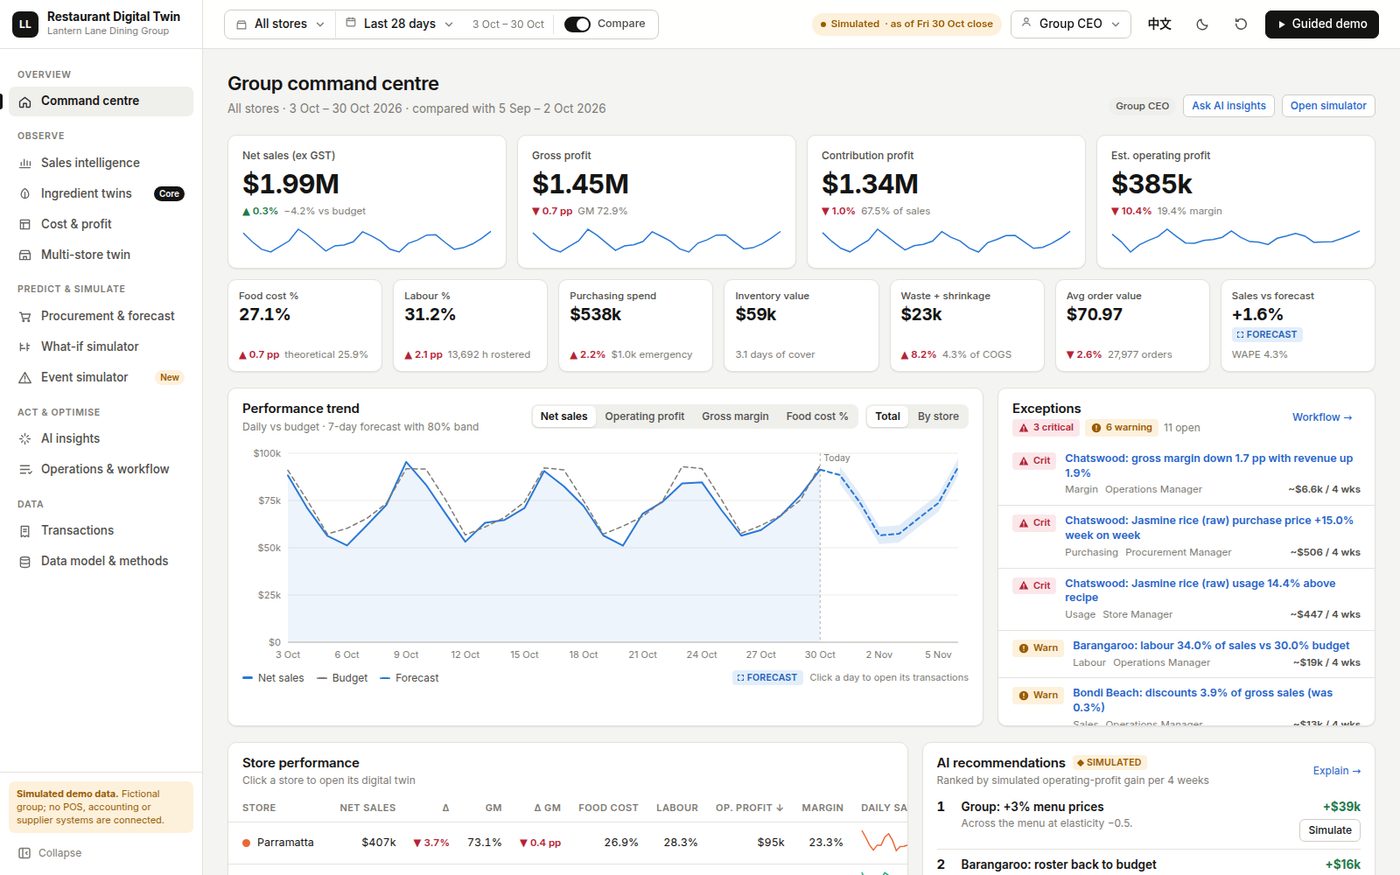
Our Restaurant Digital Twin models a fictional five-store Sydney group with 90 days of seeded, reconciled transactions, 60 dishes, 120 ingredients with recipes and 15 suppliers with price histories.
- A calculation engine independent of the screens. P&L by store, dish metrics, recipe costing and perpetual weighted-average inventory are computed from base quantities, and reconciled to the cent by tests.
- Ingredient twins. For any ingredient you can see what it was plated into, the revenue of those dishes, the profit allocated to it by an explicit rule, and what it cost. We wrote about the flagship example in What did one kilogram of rice earn?.
- What-if and event simulators. Change a supplier price, a portion or sales mix, or simulate an incident, and every affected number is recomputed from the same model.
- Forecast-driven replenishment. Suggested purchase orders come from forecasts, go through approvals and leave an audit trail.
- A guided demo. Nine steps take a viewer from a margin anomaly at one store to its causes — a local rice supplier and over-recipe usage — and end with an approved purchase order and its verified effect on inventory.
- English and 简体中文, because many groups run kitchens and head office in more than one language.
Questions it helps an owner answer
- Which store's margin moved this week, and which dishes and ingredients explain it?
- Is the cause a supplier price, over-portioning, waste or the sales mix?
- If a supplier raises prices by a certain amount, what happens to each store's gross margin?
- Should we change the recipe, the menu price or the supplier?
- How much should each store order this week, and who approved it?
- Which dishes earn their place on the menu once ingredient cost is allocated honestly?
What changes
Before: the month closes, food cost is up, and the explanation is a meeting. Purchasing is based on the head chef's memory. Supplier negotiations happen without knowing what a price change really costs across the group. Stores are compared on totals.
After: an anomaly is flagged while it is still happening and traced to a store, dish, ingredient and supplier. A supplier's price increase is costed across every store before you accept it. Orders are suggested from forecasts and approved with a record. Store managers and head office argue from the same numbers. Menu decisions use contribution per dish, not just popularity.
Getting there in your group
You do not need new hardware. The twin is built from systems you already run:
- Discovery. Export a few months of POS sales, your recipe cards (even in spreadsheets), supplier invoices or price lists, stock counts and waste logs. We check how they link and where the gaps are — often recipes are the weak spot.
- Prototype on your data. We replace the seeded generator with your exports, reconcile the result against your accounts, and show you the first anomalies and what-ifs on your own stores.
- Connected twin. Scheduled feeds from POS, accounting and suppliers keep it current, and purchasing approvals move into the twin's workflow.
Questions worth asking any vendor:
- Does the system reconcile to my accounts, to the cent, and can I see the tests?
- When it allocates profit to an ingredient, is the rule explicit and can I change it?
- Are forecasts and what-ifs computed from the same model as the P&L, or from a separate spreadsheet?
- Is every approval and change recorded?
Honest limits
The group, stores, dishes, suppliers and every transaction in the demo are fictional and seeded. No POS, accounting or supplier system is connected. Profit allocation to ingredients is a choice of rule (by cost, quantity or equal share), not a fact — the twin makes the rule explicit rather than hiding it. Forecasts in the demo run on synthetic history and say nothing about real demand.
See it
- Live twin: restaurant.octopustwin.com
- Case study: Restaurant Digital Twin
- Want to see your own stores in it? Talk to us.