In a commercial office tower, heating, ventilation and air conditioning is typically the largest single use of energy, and it is the part of the building that owners understand least. The plant sits in the basement and on the roof. The controls were set at commissioning years ago. The building management system produces thousands of trend points that nobody has time to read. And tenants only call when it is too hot or too cold.
So owners are offered HVAC optimisation as a percentage: fifteen, twenty, thirty per cent. Those numbers are hard to argue with and impossible to verify. The question behind them, how much energy would this building have used without the change?, has no measured answer, because the building only runs once. Meanwhile, faults such as a drifting sensor, a stuck damper or a tripped chiller can quietly erase whatever was saved.
What a digital twin means here
A digital twin of a building is a physics model of the building and its plant, run in step with the real thing and fed by the same signals a BMS sees. Unlike a 3D model, it can answer what if: what if we change the setpoints, add storage, fix this fault. We describe the general idea in What is a digital twin?.
The most useful property of a twin for an owner is that it can run the building twice. One copy uses conventional control, and the other uses the proposed strategy. Both see the same weather and the same occupancy. The saving is the difference between the two meters, a measured result rather than a promise. We explain that method in more depth in Measured, not claimed.
What we built
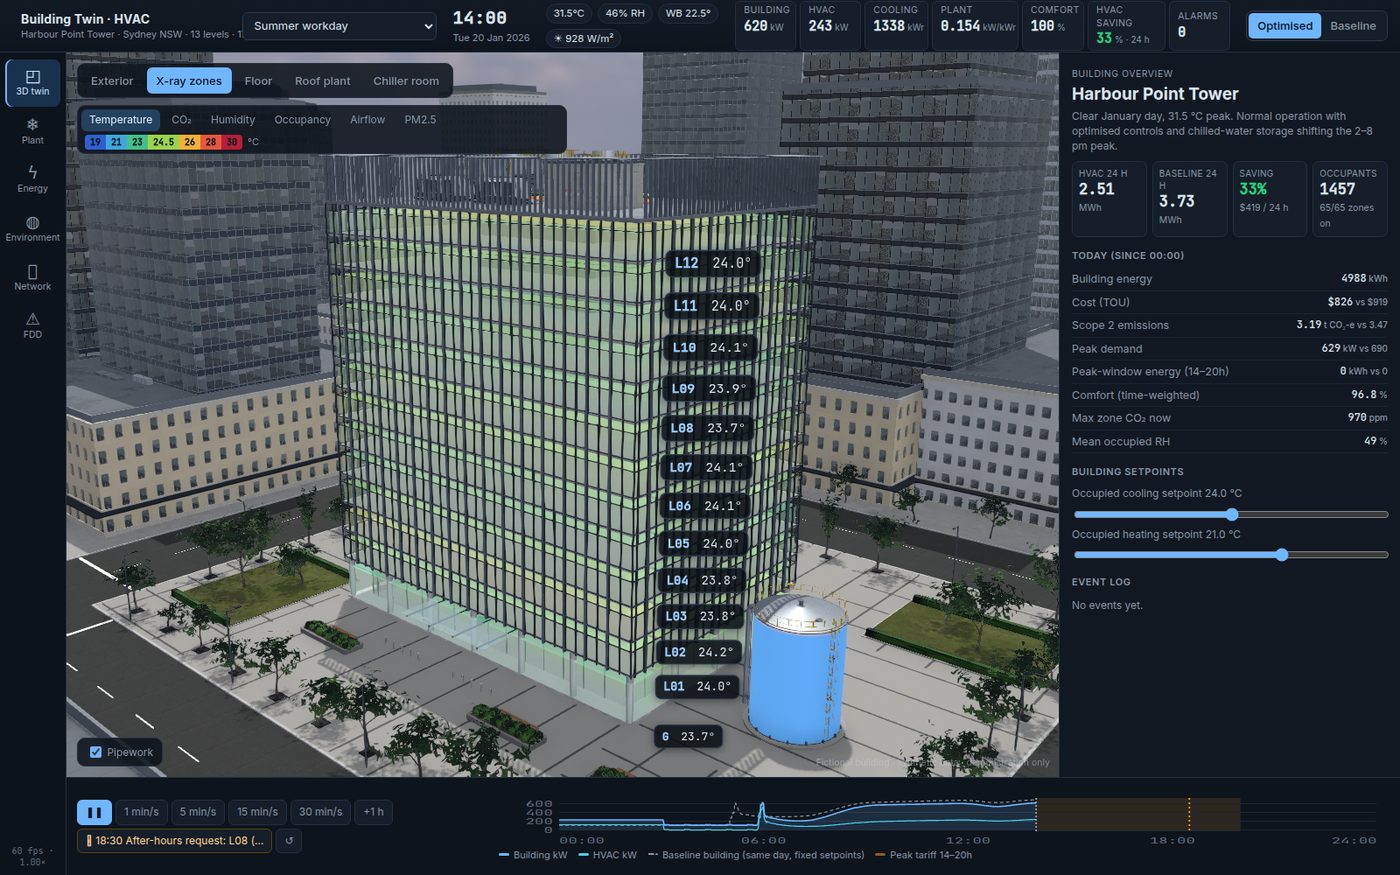
Our Building Twin · HVAC models Harbour Point Tower, a fictional 13-level A-grade office tower in Sydney with about 17,600 m² of lettable area and four fictional tenants.
- The whole HVAC system, from roof to basement. There are 65 thermal zones, each with a VAV box, and 13 floor air-handling units. In the basement, two 1,050 kWr magnetic-bearing chillers and a 525 kWr screw chiller. On the roof, three cooling towers. Two air-to-water heat pumps, and a 6 MWh chilled-water storage tank on the plaza. One physics model runs all of it in 60-second steps.
- A baseline twin running alongside. The baseline uses conventional control. The optimised twin adds supply-air temperature resets, demand-controlled ventilation, optimum start and off-peak storage. On the simulated summer design day, the optimised strategy uses about a third less HVAC energy than the baseline.
- Points the way a real BMS sees them. The model has 88 devices and 1,063 BACnet and Modbus points, tagged with Brick classes, so data can be found by what it means rather than by whatever someone named it.
- Faults that are found the honest way. We inject six faults: a drifting supply-air sensor, a stuck VAV damper, a cooling-tower fan drive fault, a lost controller trunk, a chiller trip and a stuck outdoor-air damper. Fault detection may only use points a real BMS would expose.
- A building you can walk through. X-ray floors, a sectioned air-handling unit, the rooftop plant and a piped chiller room make it easy to explain to a board or to tenants.
Decisions it helps you make
- What would this building have used without the upgrade, and so what did the upgrade actually save?
- Which strategies are worth paying for here: supply-air resets, demand-controlled ventilation, optimum start, thermal storage?
- Is chilled-water storage and an off-peak tariff worth the capital in our climate and tariff structure?
- Which faults are costing us money right now, and which can we detect with the points we already have?
- What do we need to measure that we currently do not?
What changes
Before: energy projects are bought on percentages and judged on utility bills that also move with weather and occupancy. Faults are found when tenants complain. The BMS point list is a spreadsheet nobody trusts, and every contractor renames things.
After: a proposed upgrade can be tested on the twin before it is bought, and judged after installation against a calibrated baseline. Facility managers see faults with the evidence that triggered them. Tagged points make data usable for analytics, for a new contractor or for an ESG report. The board conversation moves from we were promised 20 % to this is the measured difference, and this is what it rests on.
Getting there in your building
- Discovery. We gather drawings, the plant schedule, the BMS point list and trend logs, utility and sub-meter data, and the tariff, and agree on the questions to answer, for example a planned upgrade or a persistent comfort complaint.
- Prototype on your data. We model your building and plant, calibrate zone and plant behaviour against your trend logs, and set up the baseline twin. Every figure is labelled as simulated or calibrated.
- Connected twin. We connect to the live BMS over BACnet/IP, run fault detection on your real points, and carry out measurement and verification against the baseline twin.
Ask any vendor: What is your baseline, and can I inspect it? Does your fault detection use only points my building actually measures? Who owns the point model and the data after the project?
Honest limits
Harbour Point Tower is fictional, and all data in the demo is synthetic. The geometry is for demonstration and is not verified BIM. The roughly one-third saving applies to one simulated summer design day on this model and these assumptions. It is not a promise for your building, and it has not been compared with metered data.
See it for yourself
- Live twin: hvac.octopustwin.com
- Case study: Building Twin · HVAC
- Considering an HVAC upgrade? Talk to us about measuring it first.