Growing is a business with a long feedback loop. A heat spell, a week of poor light, a missed irrigation or a nutrient shortfall shows up as smaller leaves, fewer fruit or a late harvest — weeks after the cause. By then the season's yield is set. And because each season happens once, there is no easy way to know what would have happened if you had acted differently.
For a greenhouse operator, a farm business or an agri-food company, that means expensive decisions made on experience and trial plots: when to adjust climate setpoints, whether extra lighting or CO₂ will pay back, how to respond to a stress event. Agronomy models that could help exist, but they are hard to use and harder to question.
What a digital twin means for a crop
A crop digital twin treats the plant as a function of time: its state on any day follows from its environment and physiology up to that day. That makes two things possible. You can change the environment from a given day and recompute every day after it, leaving the past untouched. And you can run two futures side by side from exactly the same state and compare them.
The difference between those futures is how a twin answers "why" — not with a scripted explanation, but with a measurable divergence that can be traced back through physiology to the environment.
What we built
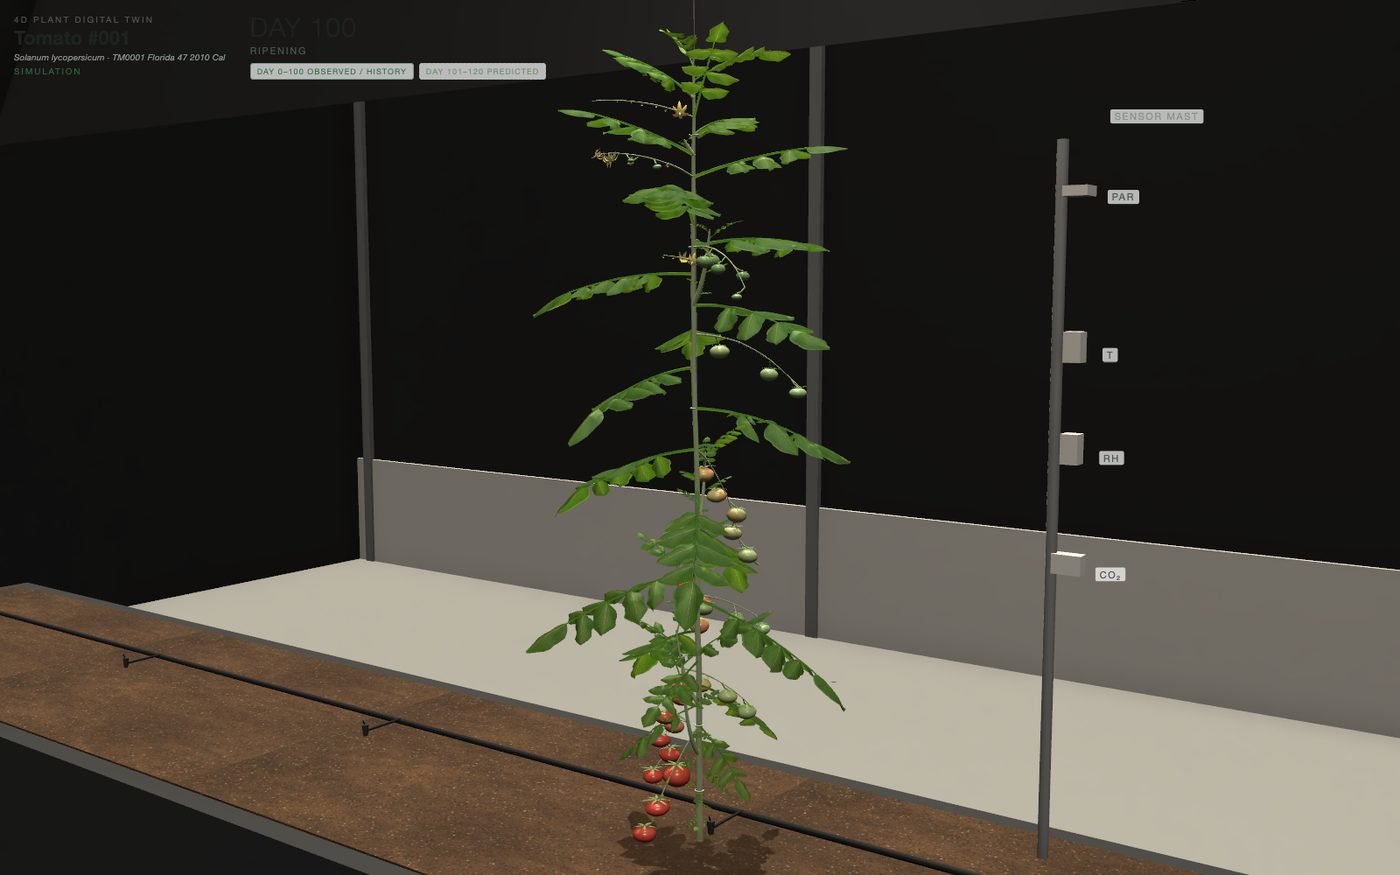
Our 4D Plant Digital Twin grows a tomato (and nine other crops) from emergence to ripening over 120 days.
- A daily physiology model. Response curves for temperature, light, CO₂, water and nutrients drive light interception, assimilation, respiration and allocation to leaves, stem, roots, flowers and fruit, then organ development. Species parameters come from the published DSSAT CROPGRO genotype files, with provenance recorded per crop.
- Immutable history, recomputed future. Change the environment on day 45 and only days 46 onward are recomputed; the timeline shows history, now and a predicted future with an uncertainty band.
- Futures side by side. Two or three futures branch from one state — for example control, drought, and drought followed by recovery — and render in a synchronised split view.
- Causes derived, not scripted. Causal events, time-to-effect and explanation chains are read from the difference between trajectories. Click a leaf or a metric and the twin shows what limited it.
- Geometry from state. Every leaf, stem, flower and fruit in 3D is generated from the simulated state, so what you see is what the model computed.
- Ready for observations. A defined record shape for camera, LiDAR, multispectral and IoT data shows where real measurements would enter.
Questions it helps a grower answer
- If we change light, water, temperature or CO₂ from next week, what happens to fruit set and harvest timing?
- Why is this crop behind plan — which factor is limiting it, and since when?
- If a stress event happened, how much does an early recovery action recover?
- Which intervention gives the largest effect at day 120 for the same effort?
- How would a different crop respond to the same climate schedule?
What changes
Before: interventions are judged after the fact, a season at a time. Explanations of poor yield are informed guesses. Investment in lighting or CO₂ is justified with general figures. Knowledge sits with a few experienced growers.
After: an intervention is previewed on the model before it is committed, and its effect is compared with doing nothing. A poor result comes with a traceable chain from environment to physiology to yield. Investment cases are argued with side-by-side futures. Agronomists and managers discuss the same picture, and new staff can explore it.
Getting there on your operation
- Discovery. Your crops and cultivars, climate setpoints and sensor logs (temperature, humidity, light, CO₂, irrigation), and growth or harvest records from past seasons.
- Prototype on your data. We drive the model from your recorded climate and compare its trajectory with your measured growth, then calibrate for your cultivar.
- Connected twin. Sensor and camera feeds update the twin's state continuously, so predictions start from what the plants are actually doing.
Questions worth asking any vendor:
- Which published crop model and parameters does the twin use, and for which cultivar has it been calibrated?
- When the twin explains a result, is the explanation derived from the model, or written in advance?
- Does it show uncertainty, and how?
- How do real measurements correct the model's state?
Honest limits
The growth model in the demo is a simplified demonstration model. Species parameters come from published sources, but the model is not validated for any cultivar or site and must not be used as agronomic advice. The uncertainty band is simulated. The twin shows how decisions can be tested and explained; calibration on your own measurements is what would make its numbers useful.
See it
- Live twin: plant.octopustwin.com
- Case study: 4D Plant Digital Twin
- Growing under glass or in the field? Talk to us.