A third-party warehouse sells space, handling and trust. Space is fixed once the racks go in. Handling is where margin leaks: every metre a truck drives empty, every pallet put away in the wrong aisle and every hour a dock door waits is paid for in labour and equipment. Trust is the hardest to rebuild: when a customer's count disagrees with yours, you need to show where the pallet went, not just that the system says it is there.
Most of the rules that decide all this — where a new pallet goes, which truck takes which task, when stock is counted — are set once, tuned by intuition and rarely measured. Changing them on a live floor is a risk nobody wants to take in peak season.
What a digital twin means in a warehouse
A digital twin of a warehouse is not a 3D picture of racks. It is a working model of the building, the fleet, the stock and the demand, run in simulated time, so that you can ask "what if we put away differently?" and get an answer measured in truck hours and lead time, not opinion.
The useful part is comparison. The same day of orders is played twice — once with today's rules and once with the proposed ones — and the difference between the two is the value of the change.
What we built
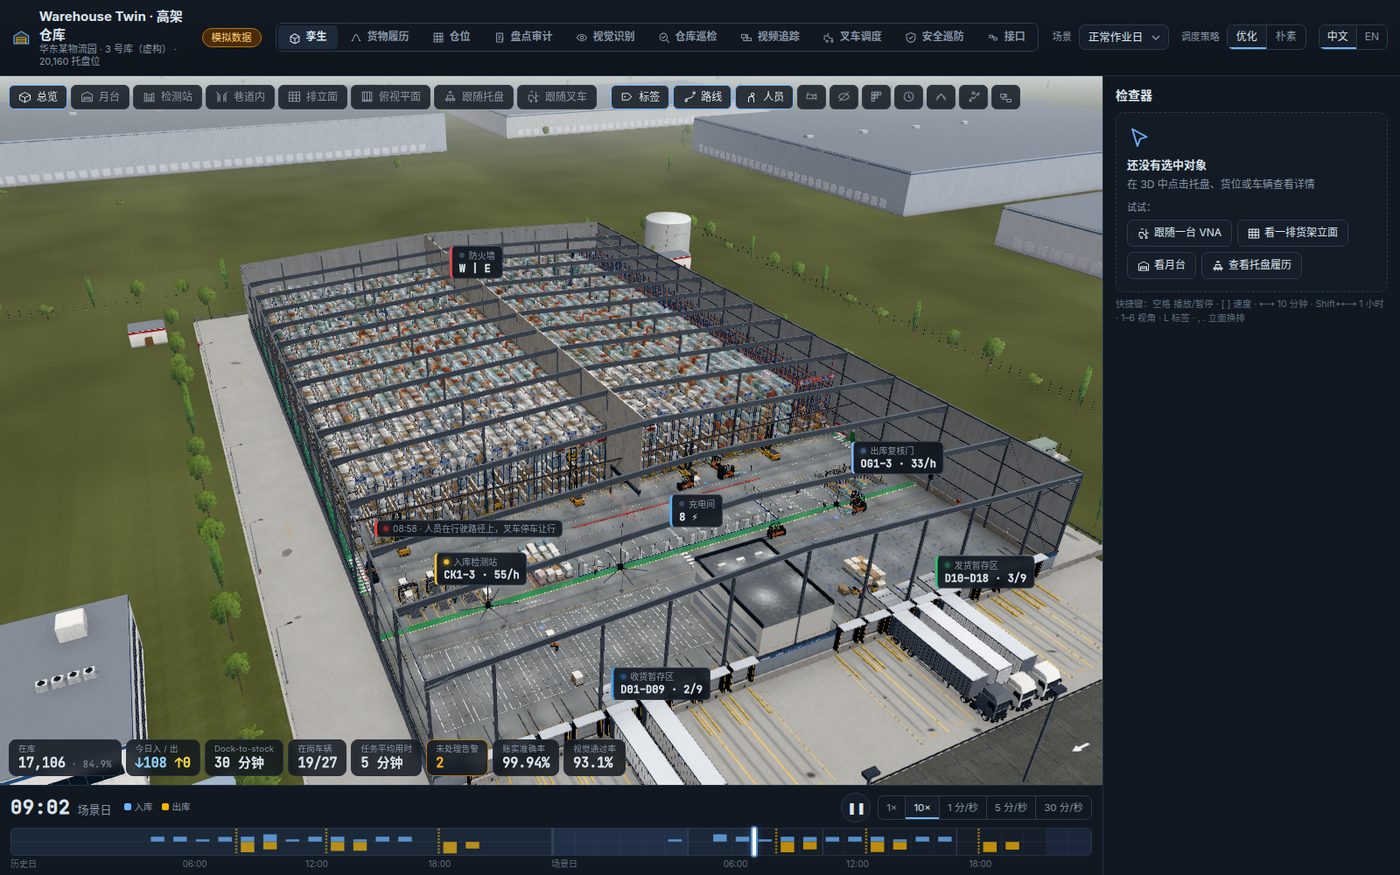
Our Warehouse Twin models a fictional, representative multi-customer high-bay warehouse, sized from a client site sketch: about 75 m wide, 26 rack rows with roughly 12,000 pallet positions over six levels, 13.7 m clear height, reach-truck aisles, a drive-through tunnel and eight dock doors. Its customers are fictional but deliberately awkward: lithium batteries, food and light industry, each with its own rules.
- Every coordinate is modelled. Rack rows, aisles, docks, staging lanes and the swept path of every truck type. Trucks cannot pivot on the spot; they drive lines and arcs and back out of handling faces, so travel times are physical, not straight-line guesses.
- Two strategies run in lockstep on the same demand. One twin uses a naive policy (first feasible slot, first-in-first-out dispatch); the other scores slots and assigns tasks to trucks with an optimisation (the Hungarian algorithm). Lead time, cycles per hour, empty travel and aisle changes are measured on both.
- Hard rules are enforced, not suggested. The lithium zone is segregated by level and capacity with a buffer to food; the simulation will not place a pallet where the rules forbid it.
- Every pallet has a journey. From dock to slot to truck, each pallet's history can be replayed. Counts from virtual cameras feed a discrepancy workflow, and the audit log is hash-chained so it cannot be quietly edited.
- Safety and inspection. A patrol robot runs inspection rounds, findings become work orders, and a demo anomaly scenario shows a lithium hot spot found and the pallet moved to quarantine.
Every page carries a simulated-data badge.
Questions it helps an owner answer
- If we change our slotting rule, how much empty travel and how many truck hours do we save on a peak day?
- Do we need another truck, or better dispatch?
- Which customers' goods are blocking the fast aisles?
- Can we take on a new customer with dangerous goods without breaking our segregation rules?
- When a customer disputes a count, can we show the pallet's full history in minutes?
- Where do people and trucks come close, and how often?
What changes
Before: rules are changed on the floor and judged by gut feel weeks later; a capacity question becomes a request for another truck; stock disputes are settled by searching the racks; safety rules live in a binder.
After: a rule change is tested on a replayed peak week first, and the decision comes with numbers. Capex decisions (another truck, another aisle, a new customer) are argued with modelled utilisation instead of anecdotes. Supervisors see the same picture as management. Customers can be shown an audit trail rather than a spreadsheet. Safety rules become code that the twin checks continuously.
Getting there on your site
A useful first twin does not need sensors. It needs data you already have:
- Discovery. Your rack layout and drawings, fleet list, WMS location master, a few weeks of order and movement history, and the rules you actually use.
- Prototype on your data. We load your locations and orders, replay a peak week, and A/B your current rules against alternatives — before anything changes on the floor.
- Connected twin. Feeds from the WMS (and later truck telematics or cameras) keep the twin in step with the building, so it can be used for daily planning and audit.
Questions worth asking any vendor:
- Are travel times computed from real truck kinematics and aisle geometry, or straight-line distances?
- Is the saving measured against a baseline run on the same demand?
- Can I see which numbers are measured, which are simulated and which are assumptions?
- Can I replay a single pallet's history end to end?
Honest limits
The warehouse, customers, products and orders in the demo are fictional and seeded. The building dimensions follow a site sketch, not a survey. Truck kinematics are modelled from generic types, not a specific fleet. Vision counts and inspection photos are simulated. None of the KPIs shown is a result from a real operation — they illustrate how a strategy comparison works, and your own numbers will come from your own data.
See it
- Live twin: warehouse.octopustwin.com
- Case study: Warehouse Twin
- Have a site or a rule change in mind? Talk to us.