If you run a museum, a planetarium, a science centre or an education business, you know the economics of content. A new exhibit or a course module costs real money to produce. It is accurate on the day it opens, then slowly drifts out of date. It plays the same way for a seven-year-old and a retired engineer. And it cannot answer the question a visitor actually asks — "how far away is Mars right now?" or "where is the Great Attractor?" — so that work falls to staff who are not always there.
At the same time the underlying science is more open than ever. NASA, ESA and the astronomy community publish maps, star catalogues and survey data that would have cost fortunes a generation ago. The gap is not data; it is turning that data into something a visitor can explore, that stays faithful to the source, and that answers back.
What a digital twin means here
Strictly, a digital twin mirrors a system you operate. Nobody operates the universe. What we build for science is a digital model — generation 1 in our framework: a faithful structure built from authoritative data, where facts and physics are known and fixed, and there is no live sensor feed.
Generation 1 is not a lesser product for this audience. For a museum or a classroom the value is precisely that every surface, position and distance is traceable to a dataset, and that the model can be explored at any scale and any date. You would only need a higher generation if you were steering something real — a telescope schedule, a satellite, a mission — where live state and scenarios matter.
What we built
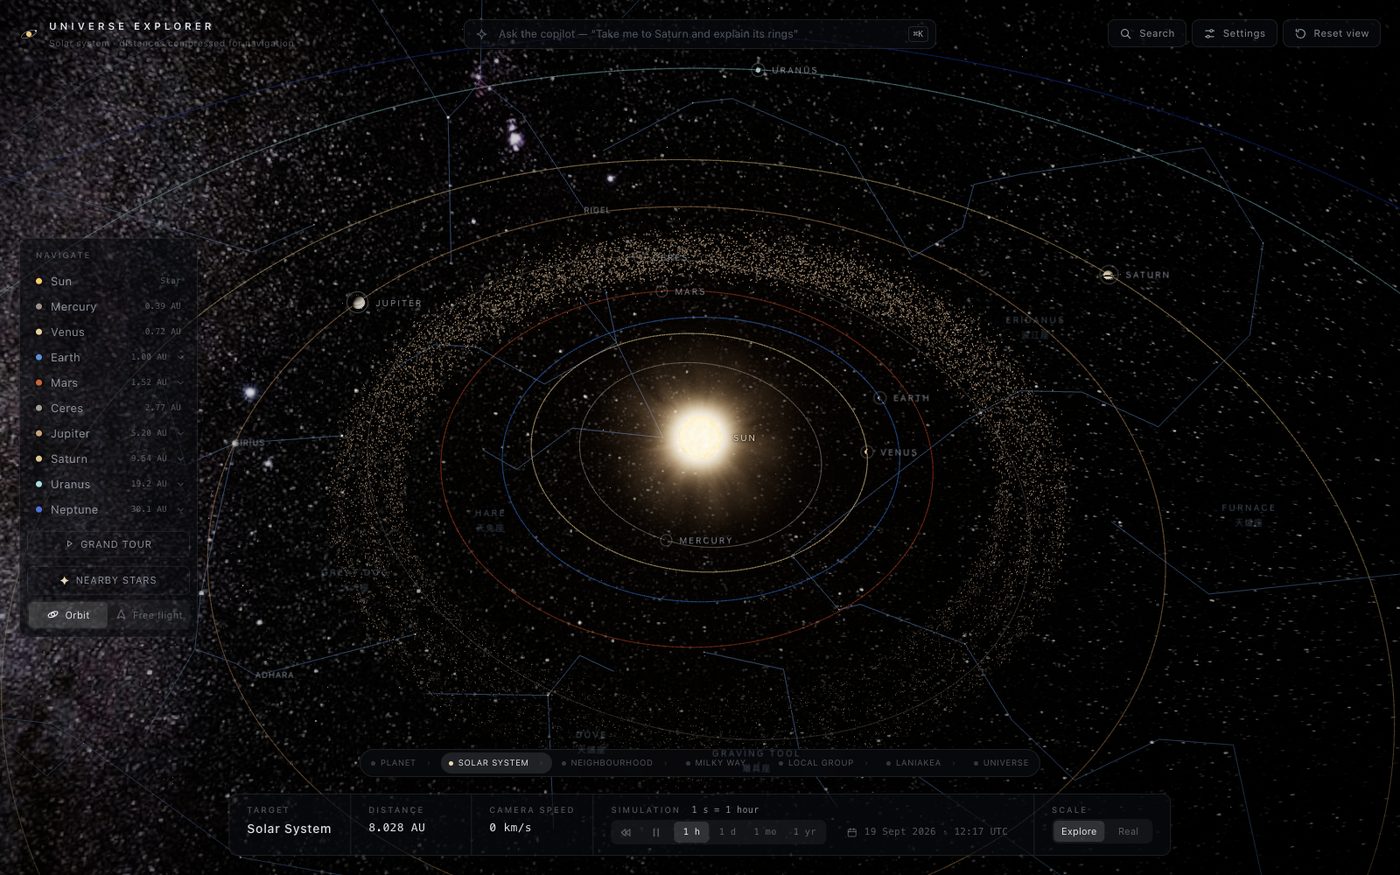
Universe Explorer is an interactive 3D universe that runs in the browser, built on a seven-level scale ladder: planet → solar system → the 60-light-year stellar neighbourhood → the Milky Way → the Local Group → the Laniakea supercluster → the observable universe out to the cosmic microwave background.
Each level comes from public data:
- real NASA/USGS global maps for every body that has one, with IAU rotation models so each world faces the right way at the simulated date, and JPL orbital elements;
- 350,000 stars from ESA's Gaia DR3 for the Milky Way, with spiral arms as fitted to measured maser parallaxes, and the panel saying which parts are data and which are model;
- the 8,315 galaxies with measured distances from Cosmicflows-2, the catalogue Laniakea was mapped from;
- the 43,507 galaxies of the 2MASS Redshift Survey, and the Planck 2018 cosmic microwave background as the outer shell.
Time runs forwards or backwards between 1600 and 2600, so a visitor can jump to 20 July 1969 or watch a year pass in seconds. An info panel recomputes live distances, orbital speed and light delay from the simulated date. A narrated grand tour gives a guided path.
The part visitors notice first is the copilot. Ask in your own language — "take me to Saturn and explain why its rings are visible", or in Chinese, "土星环是什么做的" — and Claude on Amazon Bedrock flies the camera to a suitable vantage while the answer types out, typically within about two seconds. If the service is unreachable, a built-in offline guide answers instead, so the experience never dead-ends.
Questions it helps an owner answer
- Can we offer an exhibit or lesson that answers each visitor's own question, in their own language, without a staff member at every screen?
- Can we stand behind every number on the screen when a teacher, a scientist or a journalist asks where it came from?
- Can one product serve a school group, a family and an enthusiast, at different depths?
- How do we keep content current without commissioning a new production each time?
What changes
Before: linear videos and fixed panels, accurate at launch and ageing from then on; questions answered by whoever is on the floor; separate content for each audience and language.
After: one explorable model, faithful to published data, that visitors steer by asking. Updating to a newer catalogue is a data change, not a reshoot. Staff move from repeating facts to running the experience. And because it runs in a browser, the same model works on a gallery wall, a classroom laptop or a visitor's phone.
Getting there
For an exhibit, classroom or outreach edition we would start from:
- your audience, learning goals and the stories you want to tell;
- your hardware and space (touch wall, projection, kiosk, tablets, web);
- any datasets or curated content you already hold;
- languages, accessibility needs and how the AI guide should behave with children.
We work in the usual steps: discovery to agree audiences and stories; a prototype in your space with curated tours; then a production edition with the guardrails, offline mode and content controls your institution needs.
Questions to ask any vendor: Which visuals come from data and which are artistic? Can I trace a number back to its source? What happens when the AI service is down? How is the AI kept to the facts, and in which languages?
Honest limits
This is a model, not a live observatory. A few bodies have no global map and are shown as artist's impressions, labelled as such. Some large-scale structure is drawn schematically around measured data, and the app says where. The copilot is an AI: it is constrained by the app's state and rules, but it is not a substitute for a curator's review of exhibition text.
See it
- Live: universe.octopustwin.com
- Case study: Universe Explorer
- Talk to us about an exhibit or classroom edition: contact