For a pipeline owner, the most expensive minutes are the ones after something looks wrong. A pressure transmitter on a remote section starts to fall. It could be a loss of containment, which brings environmental, regulatory and reputational exposure measured in millions. It could be a transmitter drifting out of calibration, and shutting the line for that means lost throughput, unhappy shippers and a costly restart. It could also be a scheduled change at a pump station that nobody told the control room about.
Threshold alarms do not tell these apart. They fire, and then the operator has to rebuild the picture by hand from trends across hundreds of kilometres while the clock runs. Owners carry both risks: reacting too late to a real event, and reacting too often to false ones.
What a digital twin means here
A digital twin of a pipeline is a model of how pressure, flow, temperature and inventory move along the line, through space and through time. We write this as STATE(x, t). Sensors observe the real line, and the twin calculates what each sensor should read. The gap between the two, the residual, becomes evidence. The general concept is in What is a digital twin?.
This twin is what we call a 4D causal twin. It keeps an immutable record of what was observed and an estimate of the present. From any moment it can branch into several possible futures, all sharing the same past, so you can compare responses before taking one.
What we built
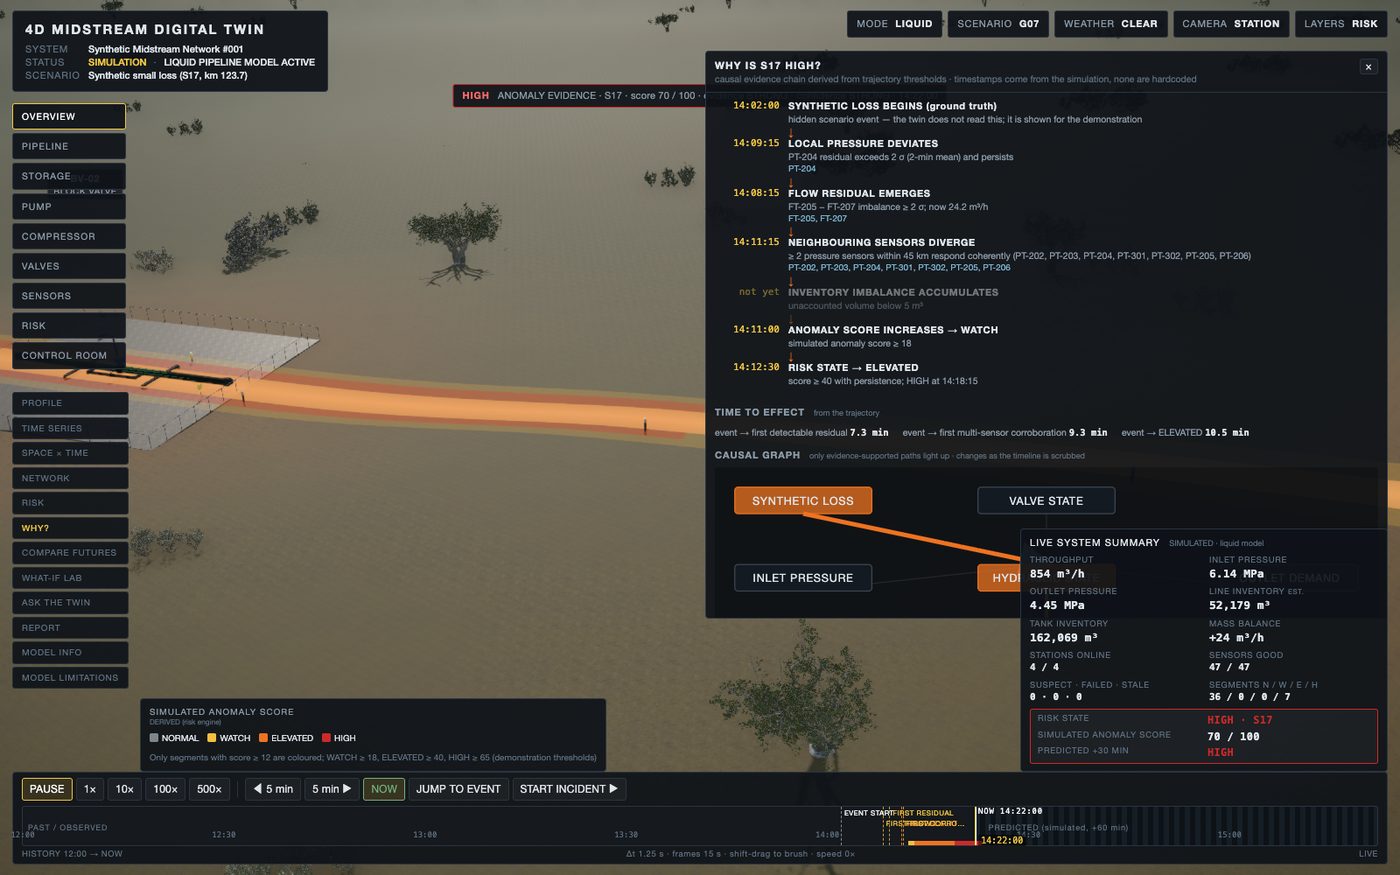
Our 4D Midstream Digital Twin models a fictional 255 km liquid products pipeline. It has a tank farm, two pump stations, block valves, metering, a branch and a delivery terminal, plus a gas-compression demonstration subsystem.
- A transient hydraulic model. A one-dimensional model is sampled at 134 points along the network, so pressure waves and inventory changes are tracked along the whole line, not only at the stations.
- 47 synthetic sensors, each with a quality flag. Every record carries what was observed, what was expected, the residual, its normal scale and a quality flag. The twin knows when a sensor is less trustworthy.
- Evidence instead of thresholds. Seven evidence channels, such as flow imbalance and corroboration from neighbouring sensors, build an anomaly score that moves through WATCH, ELEVATED and HIGH. Competing hypotheses, such as a real loss, sensor drift or an operating change, each list the facts that support and contradict them. The operator can ask why? and why not sensor failure?
- A space × time view. A heatmap of the line over time, a pipeline profile and a derived causal chain show where a disturbance started and how it spread.
- Four futures from the same moment. Continue, reduce throughput, isolate the section or change pump configuration. Each is simulated from the identical estimated state, so you can compare them side by side.
Decisions it helps you make
- Is this pressure drop a loss, a sensor problem or an operating change, and how confident should we be?
- Where along the line is the disturbance most likely to be?
- If we reduce throughput instead of shutting in, what happens to pressure and inventory over the next hour?
- Which sensors are degrading and need calibration before they cause a false alarm?
- Where would an extra instrument most improve our ability to localise an event?
What changes
Before: the control room reacts to alarms and reconstructs events from trend screens. Every false alarm costs throughput and erodes trust in the system. Post-incident reviews start from scattered logs.
After: operators see the evidence for and against each explanation, ranked and located, with the reasoning available on request. The model proposes, the evidence is shown, and the human decides. Response options are compared before one is chosen. Instrumentation and calibration budgets can be directed at the sensors that matter most. Reviews and regulator conversations start from a reconstructable record of what was observed, what was expected and what was decided.
Getting there on your line
- Discovery. We gather line geometry, elevation profile, pipe and fluid properties, station configurations, the instrument list and historical SCADA or historian data, including past events if you have them.
- Prototype on your data. We build the hydraulic model for one segment, calibrate it against your historical data, and replay past events to see how the evidence engine would have read them.
- Connected twin, in shadow mode. We connect to live SCADA or historian feeds and run the twin alongside your existing leak-detection system, without replacing it, until its performance on your line is understood.
Ask any vendor: Can the system tell me why it thinks this is a leak and not a sensor fault? How are sensor quality and drift handled? Is the score a calibrated probability or a ranking? How will it run next to our certified leak-detection system?
Honest limits
The pipeline is fictional and the sensors are synthetic. The hydraulic model is a simplified one-dimensional model. This is a demonstration of a method, not a certified simulator, leak-detection system or safety system. The anomaly score is a ranking of evidence, not a probability. Any use on a real line would run in shadow mode next to certified systems, never in place of them.
See it for yourself
- Live twin: midstream.octopustwin.com
- Case study: 4D Midstream Digital Twin
- Technical background: engineering report
- Operating a pipeline network? Talk to us.