For a manufacturer, energy used to be a bill. Now it is a portfolio: rooftop and ground-mounted solar, a battery, perhaps an electrolyser and hydrogen storage, a grid connection with a demand limit, and production loads that cannot simply stop. Each asset comes with its own vendor, its own model and its own promise.
The owner's questions are about the whole system. How much of our energy will actually come from our own solar? Is the battery big enough to cover the evening peak? Does hydrogen earn its place, or is it a showcase? And what happens to production if the grid fails on a Tuesday afternoon? Those questions are hard to answer when every asset was sized in a different spreadsheet.
What a digital twin means for an energy campus
An energy digital twin is a model of every generator, store and load on site, dispatched step by step by the same control logic the site would use, with the energy balance checked at every step. Because it runs in time, it shows not just annual totals but the moments that matter: the cloudy hour, the production peak, the outage.
It also lets you try a different strategy, a bigger battery or a new load without buying anything.
What we built
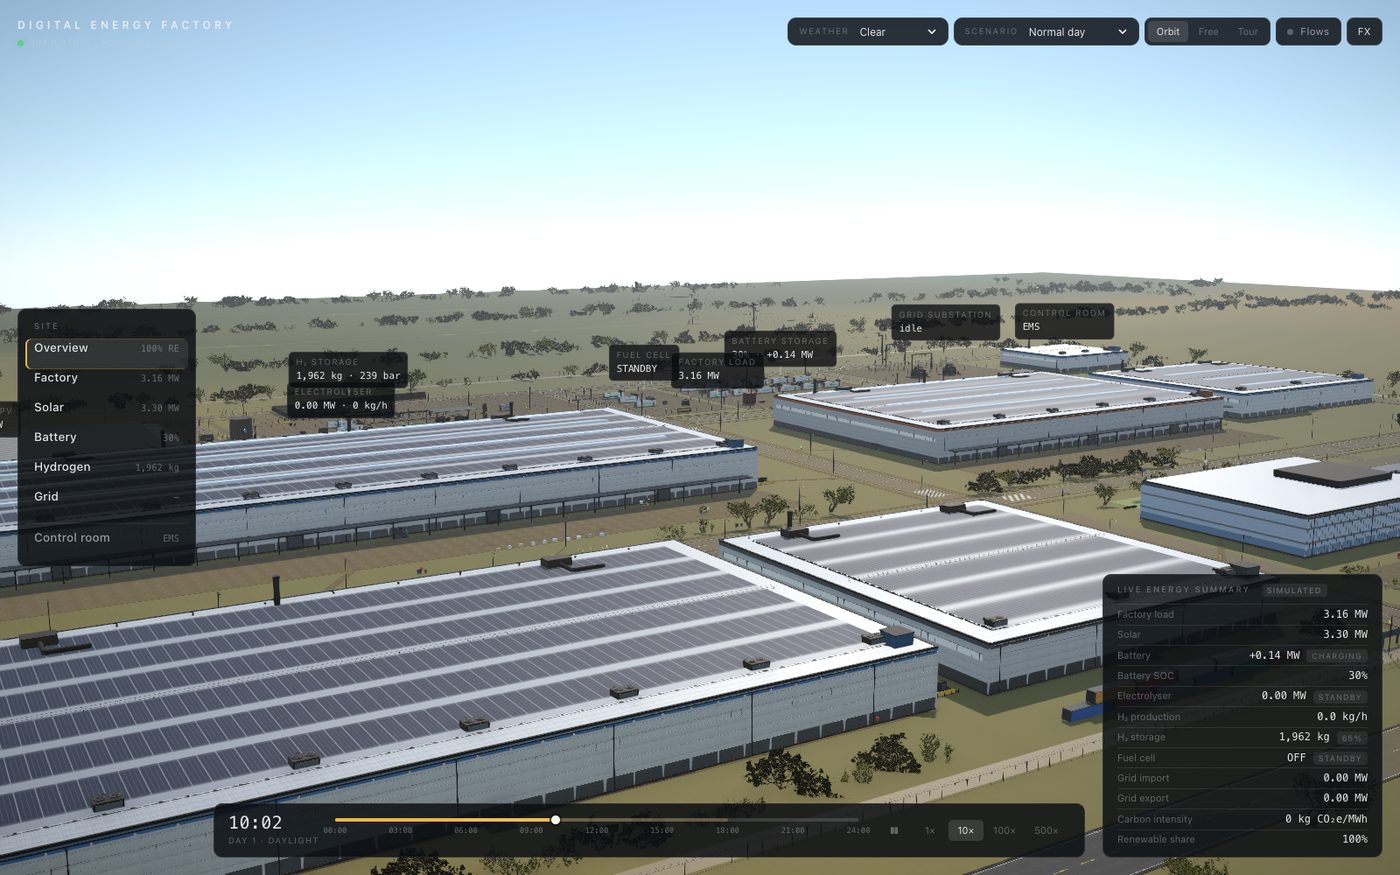
Our Digital Energy Factory is a fictional industrial campus in 3D with solar PV, battery energy storage, green hydrogen (electrolyser, compressed storage, fuel cell and refuelling), a grid connection and factory loads.
- An energy-management simulation with exact balance. At every step, PV, battery, electrolyser, fuel cell, grid and loads add up — the balance residual is checked by the acceptance tests.
- Explicit dispatch rules. Deficits are covered first by the battery down to an outage reserve, then by the fuel cell at the evening peak while hydrogen storage is high enough, then by the grid within its connection limit. Surpluses charge the battery and run the electrolyser.
- Scenarios on the live timeline. Normal day, high solar, peak factory load, cloud event, night operation and grid outage. In the outage the site islands: the fuel cell starts early, the battery runs to its floor, non-critical load is shed and critical processes stay online.
- A control room view. Live energy bars, a Sankey of power flows, the balance equation and the dispatch checklist, next to a photographic 3D campus with workers and traffic. Click any asset for its state: battery charge and cycles, electrolyser output and efficiency, hydrogen inventory and pressure.
- Tested. Headless acceptance checks cover the energy balance, every scenario switch and the outage response.
Questions it helps an owner answer
- Where does every kilowatt-hour on site come from and go to, hour by hour?
- How much of the solar is used on site, and how much is exported or curtailed?
- Is the battery sized for the evening peak, or for outages, or for neither?
- When does hydrogen production and the fuel cell actually run, and what does it displace?
- If the grid drops during production, which loads stay up and for how long?
- What changes if production adds a shift or a new line?
What changes
Before: each asset is justified separately, usually on nameplate numbers. The board hears different stories from the solar, battery and hydrogen vendors. Outage resilience is a line in a risk register. Operators learn how the system behaves when it misbehaves.
After: the investment case is argued on one timeline, with the same weather and the same loads for every option. Sizing questions (another 500 kW of PV? a larger battery?) are tested before the purchase order. The outage plan is rehearsed in the twin and everyone can see what is shed and what stays on. Operators, engineers and executives look at the same picture of where the energy goes.
Getting there on your site
- Discovery. Interval meter data for the site (ideally 15- or 30-minute), your tariff and connection agreement, single-line diagram, existing and planned asset specifications, and which loads are critical.
- Prototype on your data. We replace the demo's irradiance, tariffs and load profiles with yours, model your assets, and compare dispatch strategies and sizing options for your site.
- Connected twin. A link to your EMS or SCADA turns the model into a live shadow of the site, with the simulation still available for "what if" from the current state.
Questions worth asking any vendor:
- Does the model conserve energy at every step, and can I see the residual?
- Are the dispatch rules written down, and do they match how my site will really be controlled?
- Is the weather input site-specific and from a named dataset?
- Can I test an outage and see which loads are shed?
Honest limits
The campus is fictional and the dispatch model is deliberately simplified: it is a rule-based energy balance, not an electrical power-flow or protection study, and component efficiencies are representative values. Weather and loads in the demo are synthetic. The demo shows how a twin answers these questions; it does not size any real installation.
See it
- Live twin: factory.octopustwin.com
- Case study: Digital Energy Factory
- Planning solar, storage or hydrogen? Talk to us.